Posts

Showing posts with the label analytical chemistry

Methodologies in Gas-Phase Spectroscopy for Study of Polypeptides

Image
The secondary structures of proteins, such as α-helices, β-sheets, or β- or γ-turns, mainly determine the overall 3-dimensional structures of protein and these structures are mainly stabilised by interactions such as hydrogen bonding (H-bonding) and dispersion interactions. Besides that, the interaction with its biological environment also contributes to the overall structure which means the intrinsic properties of the protein are hidden. Therefore, to have a better understanding about protein structure, proteins or polypeptides must be in isolated condition where no solvent molecules are present. One of the methods that can be used to study peptides in this isolated is gas-phase spectroscopy. 3D structure of myoglobin with α-helices and random coils are shown

Polymer Chemistry: Molecular Weight of Polymers

Image
One of the chemical properties of a molecule is its molecular weight which is unique for every molecule. However, in synthetic polymer this is a bit of problem because of the nature of polymerisation reaction which produces different lengths of polymeric chains. This means synthetic polymers are polydisperse, no unique molecular weight, unlike small molecules. Therefore, the molecular weight of polymers is measured using molecular weight distribution (MWD).

The Nobel Prize in Chemistry 2014

Image
The Royal Swedish Academy of Sciences has decided to award the Nobel Prize in Chemistry for 2014 to Eric Betzig (Janelia Research Campus, Howard Hughes Medical Institute, Ashburn, VA, USA,),  Stefan W. Hell (Max Planck Institute for Biophysical Chemistry, Göttingen, and German Cancer Research Center, Heidelberg, Germany), and  William E. Moerner (Stanford University, Stanford, CA, USA) “for the development of super-resolved fluorescence microscopy"

Characterisation of Organic Compounds IV: Practice Questions

Image
1. A sample of an organic compound was analysed and it was found from the elemental analysis as: C = 53.46%, H = 6.98%, and O = 39.56%. a. Determine its empirical formula The sample was also analysed in spectroscopy and figures below show the spectrum of mass spectrometry, IR, H NMR, and C-13 spectroscopy.

Characterisation of Organic Compounds III: Nuclear Magnetic Resonance (NMR) Spectroscopy

Image
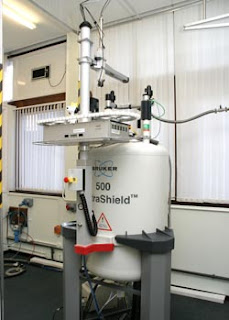
NMR Spectrometer at the University of Sheffield This is the last part of characterisation of organic compounds as in this section we will discuss about nuclear magnetic resonance (NMR) spectroscopy. In this last part, we will focus on the fundamental concepts of NMR spectroscopy, and also on H NMR and C-13 NMR. Furthermore, an exercise for this part will be given in part IV.

Characterisation of Organic Compounds II: Infrared Spectroscopy

Image
This part is the continuity of previous section, as we discussed about mass spectrometry and UV-Vis spectroscopy and this section we will see about infrared (IR) spectroscopy which tells about the functional groups in the molecule. William de Wiveleslie Abney Almost any compound having covalent bonds absorbs various frequencies of electromagnetic radiation in the infrared region of the electromagnetic spectrum. This region lies at wavelength longer than those associated with visible light, which range from approximately 400 to 800 nm, but lies at wavelengths shorter than those associated with microwaves, which are longer than 1 mm. For chemical purposes, we are interested in the vibrational portion of the infrared region. It includes radiations with wavelengths between 2.5 μm and 25 μm.

Characterisation of Organic Compounds I: Mass Spectrometry and UV-Vis Spectroscopy

Image
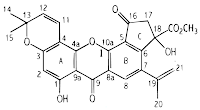
This section we will see the determination of organic compound structures from 4 types of spectroscopy; mass spectroscopy (MS), infrared (IR) spectroscopy, ultraviolet (UV) spectroscopy, and nuclear magnetic resonance (NMR) spectroscopy. Moreover, this section will discuss about mass spectrometry and ultraviolet-visible spectroscopy Artoindonesianin C - the structure was determined by spectroscopic evidence