This section we will see the determination of organic compound structures from 4 types of spectroscopy; mass spectroscopy (MS), infrared (IR) spectroscopy, ultraviolet (UV) spectroscopy, and nuclear magnetic resonance (NMR) spectroscopy. Moreover, this section will discuss about mass spectrometry and ultraviolet-visible spectroscopy
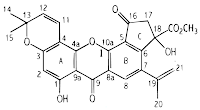 |
Artoindonesianin C - the structure was determined by
spectroscopic evidence |
Mass Spectrometry (MS)
The principle that underline MS predate all of the other instrumental techniques. The fundamental principle date to 1898 and in 1911, J.J. Thomson used a mass spectrum to demonstrate the existence of Ne-22 in a sample of Ne-20, thereby establishing that elements could have have isotopes. Nowadays, with the advent of commercial instruments that can be maintained fairly easily, are priced within reason for many industrial and academic laboratories, and provide high resolution, the technique has become quite important in structure determination studies.
 |
| The diagram of mass spectometry |
In the simplest form of the MS performs three essential functions. Firstly is it subjects molecules to bombardment by a stream of high-energy electrons, converting some of the molecules to ions, which are accelerated in an electric field. Second, the accelerated ions are separated according their mass-to-charge ratios in a magnetic or electric field. Finally, the ions that have a particular mass-to-charge ratio are detected by device which can count the number of ions striking in it. The detector's output is amplified and fed to a recorder. The trace from the recorder is a mass spectrum - a graph of the number of particles detected as a function of mass-to-charge ratio. A sample studied by mass spectrometry may be a gas, a liquid, or a solid.
 |
| trans hex-2-ene |
Mass spectra of alkenes shows a resonance stabilised cations favoured which implies the highest peak of the spectra. The highest peak in the MS means the most abundant ions which means the most stable. Besides that, the MS of alcohols shows the lose of a water molecule and
M+ may not be visible as shown in spectra of 3-methyl butan-1-ol (
M+= 88).
 |
| butan-1-ol |
Besides that, the MS can also shows the isotopes in organic molecules. For example, if the compound contain Br, it will shows 2 same intensity peaks at
M and
M+2. Moreover, for chlorine it will shows to peak at
M and
M+2 with ratio 3:1.
 |
| 2-bromopropane |
 |
| 2-chloropropane |
Spectroscopy
This part we will see how the electromagnetic radiation is used to determine the organic compound structure. There are 3 main types of spectroscopy; infrared (IR), ultraviolet (UV), and nuclear magnetic resonance (NMR) spectroscopy. Infrared spectroscopy measures the bond vibration frequencies in a molecule and is used to determine the functional group. UV spectroscopy uses electron transitions to determine bonding patterns. Lastly is NMR spectroscopy detects signals from hydrogen atoms and can be used to distinguish isomers. The basis of these spectroscopy methods is based on the electromagnetic radiation (see
wave properties). This part we will see only UV-Vis spectroscopy and the rest of spectroscopy will be discussed in later part.
Electronic or Ultraviolet-Visible Spectroscopy
Most organic molecules and functional groups are transparent in the portions of the electromagnetic spectrum which we call the ultraviolet (UV) and visible (Vis) regions - that is the region where wavelengths range from 190 nm to 800 nm. Consequently, absorption spectroscopy is of limited utility in this range of wavelengths. However, in some cases we can derive useful information from these regions of the spectrum. That information, when we combined with the detail provided by IR and NMR spectra, can lead to valuable structural proposal.
In the case of UV-Vis spectroscopy, the transitions that result in the absorption of electromagnetic radiation in this region of the spectrum are transitions between electronic energy levels. As a molecule absorbs energy, an electron is promoted from an occupied orbital to an unoccupied orbital of greater potential energy. Generally, the most probable transition is from the highest occupied molecular orbital (HOMO) to the lowest unoccupied molecular orbital (LUMO). In all compounds other than alkanes, the electrons may undergo several possible transitions of different energies. Some of the most important transitions are shown below.
 |
| The electronic transitions |
The principles of absorption spectroscopy is based on the Beer-Lambert Law which generally states the greater of the number of molecules capable of absorbing light of a given wavelength, the greater the extent of light absorption. Furthermore, the more effectively a molecule absorbs light of a give wavelength, the greater the extent of light absorption. From these ideas, the following expression can be formulated.
The molar absorptivity tells how well a compound absorbs the light. Hence, from these spectra we can calculate the molar absorptivity of a compound to decide the electronic transitions inside the molecule. For example, an organic compound sample with molecular relative mass 122 has UV-Vis spectra as shown below.
The absorbance of this sample at wavelength 260 nm is 0.85, so we can calculate the molar absorptivity at this wavelength by calculating the concentration of the sample first.
By applying the Beer-Lambert law, we can calculate the molar absorptivity constant.
From the calculation above, the molar absorptivity constant shows the transition from
n to
σ*. Moreover, if we refer to the earlier in this part this transition happens in oxygen, nitrogen, sulphur, or halogens compounds. The four main types of transitions and the value of molar absorptivity constant is shown below.
Most UV-Vis spectra involve the transitions of n to π* and π to π* and due to HOMO/LUMO energy differences, π to π* are generally more intense than n to π*. Besides that, as the π-system gets bigger, ε increases. Therefore, the highest peak of absorption goes into longer wavelength because of decreasing HOMO/LUMO energy.
 |
Left: Ultraviolet spectra of dimethylpolyenes (the compounds are in the centre).
Right: A comparison of the π to π* energy gap in a series of polyenes of increasing chain length. |
Moreover, molecules with extended conjugation move toward the visible region such as many natural pigments.
 |
| Anthocyanins |
 The molar absorptivity tells how well a compound absorbs the light. Hence, from these spectra we can calculate the molar absorptivity of a compound to decide the electronic transitions inside the molecule. For example, an organic compound sample with molecular relative mass 122 has UV-Vis spectra as shown below.
 The absorbance of this sample at wavelength 260 nm is 0.85, so we can calculate the molar absorptivity at this wavelength by calculating the concentration of the sample first.
 By applying the Beer-Lambert law, we can calculate the molar absorptivity constant.
 From the calculation above, the molar absorptivity constant shows the transition from n to σ*. Moreover, if we refer to the earlier in this part this transition happens in oxygen, nitrogen, sulphur, or halogens compounds. The four main types of transitions and the value of molar absorptivity constant is shown below.
 Most UV-Vis spectra involve the transitions of n to π* and π to π* and due to HOMO/LUMO energy differences, π to π* are generally more intense than n to π*. Besides that, as the π-system gets bigger, ε increases. Therefore, the highest peak of absorption goes into longer wavelength because of decreasing HOMO/LUMO energy.


Comments